User manual/Operation
Logging and trends
Log files, frequency, retention and real-time and historical charts.
2 min read
Loggers
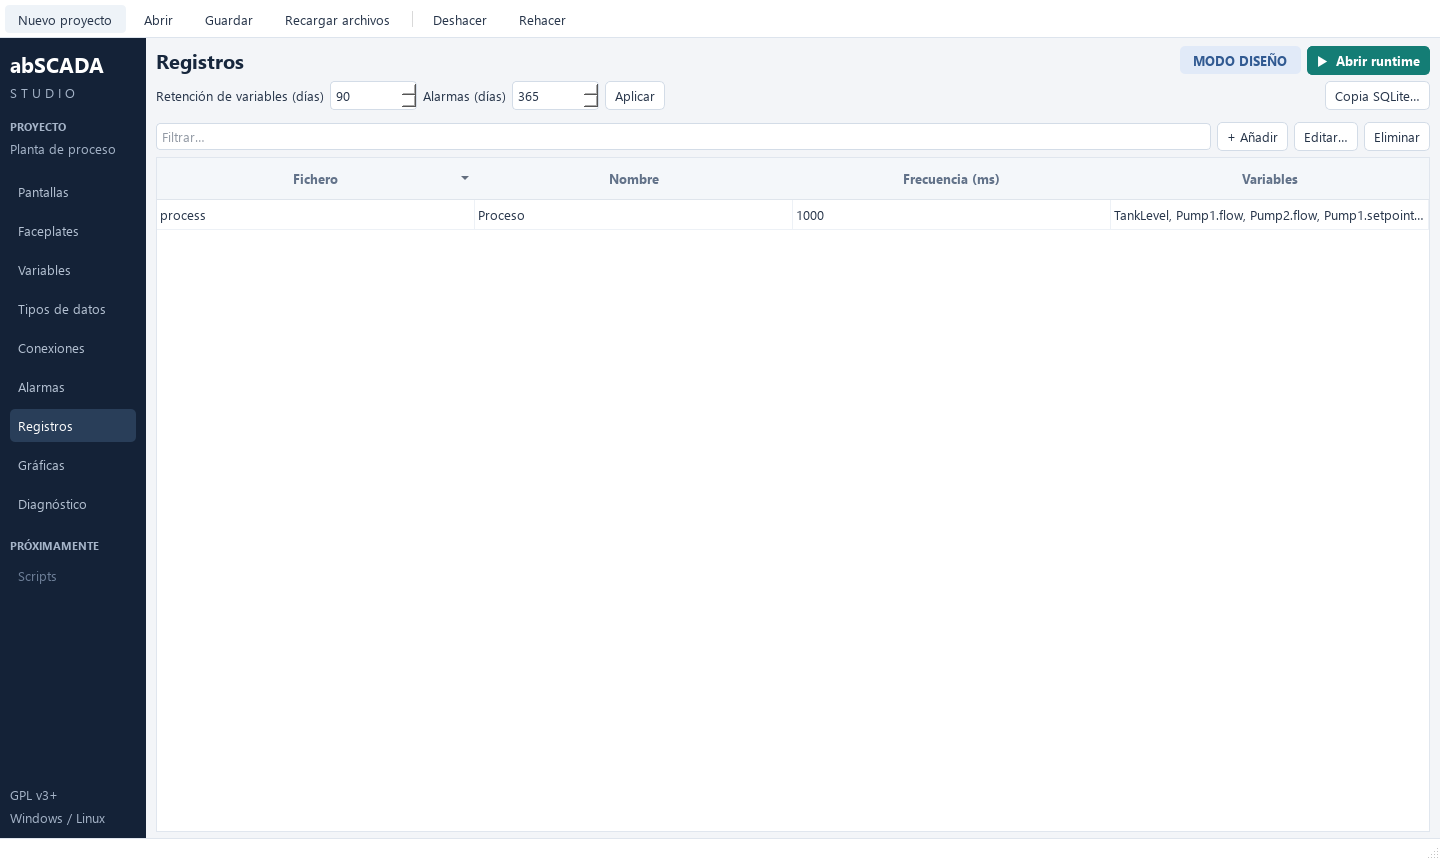
A logger is a file with a common frequency and a set of variables.
- In Loggers create a file with ID, name and frequency in milliseconds.
- In Variables, the Logger dropdown on each field picks the file or None.
- The days kept are set in Project → Project settings → Logging.
Each variable belongs to at most one logger. Data is stored in one SQLite file per UTC day:
runtime/records/process/2026-10-01.sqlite3
runtime/records/process/2026-10-02.sqlite3
Reading and logging are independent
The connection cycle decides how often the PLC is read. The logger frequency decides how often the latest reading is stored. Logging every 100 ms something read every 1000 ms repeats the last value while keeping its acquisition time.
Trends
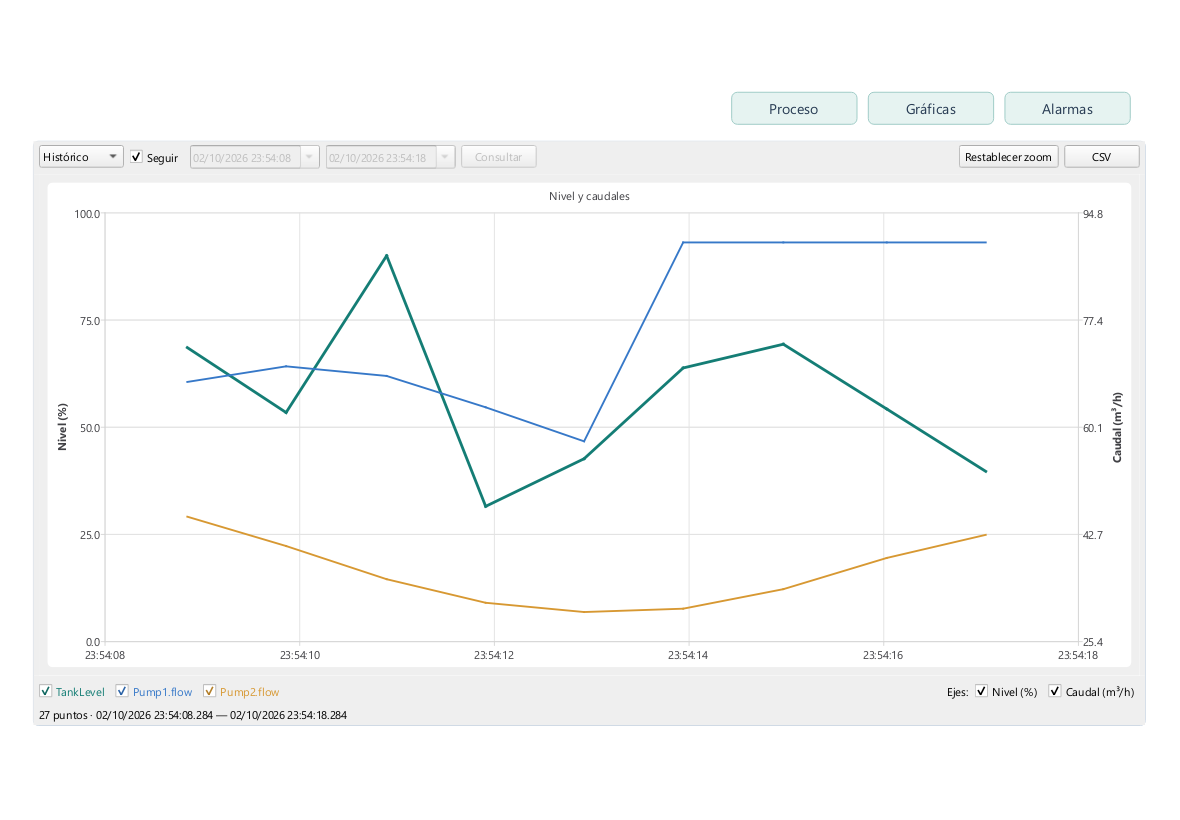
Add the Trend control to a screen and click Configurar gráfica… in the inspector (or double click). Each trend owns its configuration; copying or duplicating the control copies it too:
- Curves per variable (numeric or bool), with colour and width.
- 1 to 8 axes, left or right, with fixed or automatic scale.
- Visible time window.
Showing a variable in real time does not require logging it. Querying its past does.
In Runtime
| Feature | Description |
|---|---|
| Real time / History | In-memory buffer or SQLite query |
| Follow | Scrolls the window with time |
| Zoom and range | Fixes start and end, even across days |
| Cursor | Time and nearest value of each curve, with quality |
| Visibility | Hide curves and axes independently |
| CSV | Exports original data (up to 100000 rows) |
Bad quality breaks the curve: a good reading is never joined to another across a failure.